
Observability Control Plane
A reliability lab that connects service metrics, structured logs and traces to an actionable incident workflow.
OpenTelemetry · Prometheus · Grafana
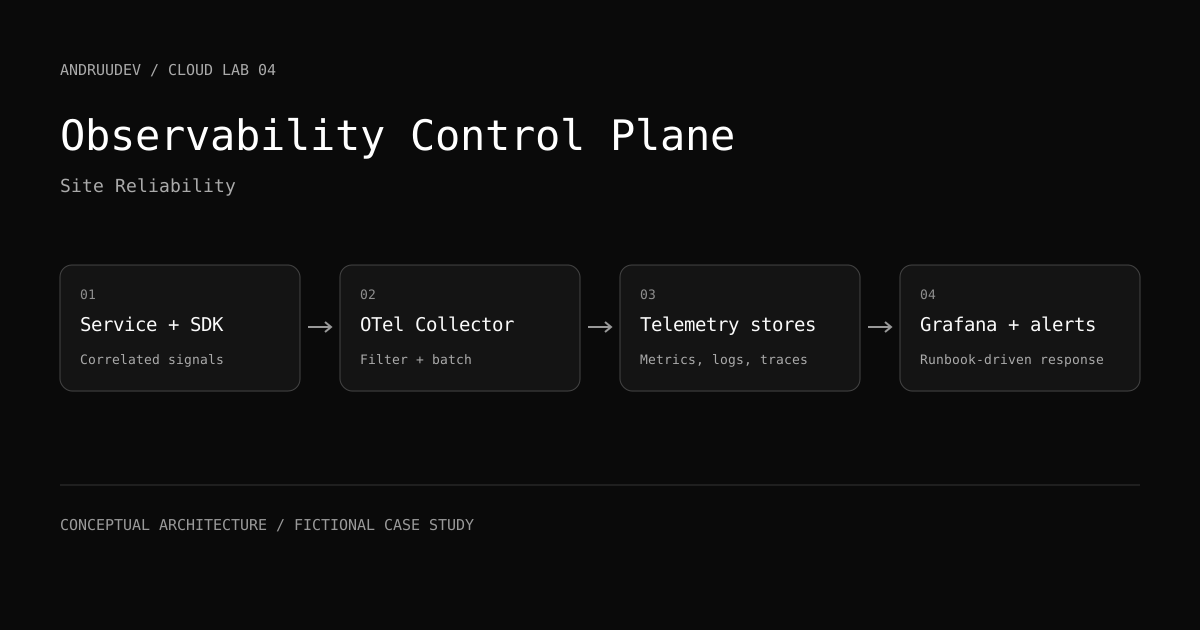
Scope: architecture and validation design. The indicators summarize design targets. Implementation evidence will be added as the lab develops.
The scenario
A fictional service exposes dashboards but no clear path from an alert to a diagnosis. Engineers inspect unrelated logs without knowing which requests were affected.
Architecture
An instrumented service emits metrics, traces and structured logs through an OpenTelemetry Collector. The design uses Prometheus for metrics, Loki for logs and Tempo for traces, with Grafana as the investigation surface. Trace identifiers connect a slow request to its downstream spans and related logs.
Key decisions
Alerts describe user-visible failure conditions and link to a runbook. Cardinality limits, sampling and attribute filtering are explicit design choices. Sensitive payloads are excluded from telemetry.
Validation plan
Inject a slow dependency and an elevated error rate in the lab. Follow the alert to a dashboard, a trace and a relevant log. Confirm the alert clears after recovery and that the documented first response matches the observed failure.
Trade-offs
More telemetry is not automatically more useful. Storage cost, label cardinality and sampling can change the investigation experience. A small set of service questions should guide instrumentation.
Next iteration
Attach dashboards and runbooks to a working demo, then time repeated incident exercises. No reduction in real customer incident time is claimed.
El escenario
Un servicio ficticio tiene dashboards, pero ninguna ruta clara entre una alerta y el diagnóstico. Se inspeccionan logs desconectados sin saber qué solicitudes fueron afectadas.
Arquitectura
Un servicio instrumentado emite métricas, trazas y logs estructurados mediante un OpenTelemetry Collector. El diseño usa Prometheus para métricas, Loki para logs y Tempo para trazas, con Grafana para investigar. Los identificadores de traza conectan una solicitud lenta con sus spans y logs relacionados.
Decisiones técnicas
Las alertas describen fallos visibles para usuarios y enlazan a un runbook. Los límites de cardinalidad, el muestreo y el filtrado de atributos son decisiones explícitas. Los payloads sensibles se excluyen de la telemetría.
Plan de validación
Introducir una dependencia lenta y una tasa de errores elevada en el laboratorio. Seguir la alerta hasta un dashboard, una traza y un log relevante. Confirmar que la alerta se resuelva al recuperarse el servicio y que el runbook corresponda al fallo observado.
Concesiones del diseño
Más telemetría no garantiza más utilidad. El costo, la cardinalidad y el muestreo afectan la investigación. Un conjunto pequeño de preguntas operativas debe guiar la instrumentación.
Próxima iteración
Adjuntar dashboards y runbooks a una demo funcional y medir ejercicios de incidentes repetidos. No se afirma una reducción de incidentes de clientes reales.